Why Log Analysis?
Logs are used to check the behavior of a system or an application. Though the content and the log format is different in different systems and component for same system or distributed systems. Based on the system the content and the usage of the logs vary. For a distributed architecture, log analysis is not only one of the most important aspect to check performance, but also it is helpful in different aspects as follows –
- To debug an issue
- To analyze the performance of an application
- To analyze the security aspect of an application
- To do predictive analysis
- To use in Internet of Things
What is the challenge in Log analysis?
At present, generally we do log analysis or rather keep track of logs for a distributed system like microservices in different systems and components. But while aggregating the logs or tracing a problem it becomes a tedious job and not only that, there are other problems too. As an example –
- Different log formats
- Decentralized Logs
- Accumulation of logs from different Nodes
- Required SME for log analysis
Keeping all the limitations and the problems in mind, for any distributed microservice architecture any opensource central logging mechanism is needed.
What are the drawback to use logging mechanism in Microservices?
Though microservices helped to overcome many legacy problems and it allows us to create with various additional benefits like: breaking the monolith, desired control to code, team size, dependency, release cycle, maintenance, cloud connection.
Challenges in distributed architecture logging:
- Monitoring the log.
- No common resource sharing amongst the services.
- Logging, Maintaining and retrieving the services are not easy.
Key considerations for Log storing and analysis:
The service or process should run as out-of-process service and should be easy to deploy.
Configuration and management:
- The output of the services should be an agnostic format, that is, independent of the machine, system and network protocol, which will be easier and better while constructing pipelines.
- The log collection process should be fail-safe and should not generate cascade failure logs.
- In the event of a transient failure in sending information to a data sink, the monitoring agent or log-collection service should be prepared to reorder telemetry data so that the newest information is sent first.
Ingestion rate:
- Aggregate metrics by calculating statistics and send that data to the monitoring system.
- processing only a percentage of the events.
- Parallel call and batch the data to reduce the number of network calls to the monitoring service.
Cost:
- The cost of storing and ingesting data might be high, based on the need you need to process, downsize and sample the telemetry the data and send post aggregation.
Fidelity of Data:
- To make the data accurate and without any deviation.
Latency:
- Realtime data needed so that no discrepancy is there.
Storage:
- Though storage is a costly option for big applications, still data should be stored in permanent storage and should be used for future use.
Dashboard and Visualization:
- Overall resource allocation for capacity and growth. This includes the number of containers, file system metrics, network, and core allocation.
- Container metrics correlated at the service level.
- System metrics correlated with containers.
- Service errors and outliers.
What are the available tools in the market?
The log analysis tools available in the market are as follows:
- Splunk (not open source [has free and paid plans])
- Loggly (cloud based logging management)
- Logentries (cloud based logging management)
- GoAccess (open source – Github)
- io (not open source [has free and paid plans], but uses ELK as a service)
- Graylog (open source)
- io (not open source, has paid plans)
- Logstash (open source – core services for ELK stack)
- Sumo Logic (not open source [has free and paid plans])
- Papertrail (not open source [has free and paid plans])
- Fluentd (open source)
Splunk was the historical leader till now, but based on the current trend and downloads ELK stack is becoming one of the world’s most popular log management platform. Even the biggest competitor of Splunk, which is Logz.io uses ELK stack as a service.
What is the extra edge provided by ELK?
ELK stack is combination of three open-source products. Elasticsearch, Logstash and Kibana. And, all of these products are developed by Elastic.
Brief of ELK:
Elastic Search:
The power of ELK stack is that, Elasticsearch, which runs on the NoSQL DB and the Apache Lucene search engine, provides and consumes JSON.
Key points about Elasticsearch:
- Started off as scalable Lucene.
- Horizontally scalable search engine.
- Each shard is inverted index of documents.
- Can handle structured data and can aggregate quickly.
- Often a faster solution than Hadoop/Spark/Flink etc.
Logstash:
It is the logging pipeline tool for collecting dynamic data, managing events and logs. Moreover, user can parse the log and analyze and store the logs for future use.
Key points about Logstash:
- Ways to feed data in Elastic Search.
- It can monitor log file, parse them and import into almost real time.
- Pushes data from different machines and services in distributed environment.
Kibana:
It is basically the UI of the ELK stack, where visualization of the logs and timestamp data is being provided.
Key points about Kibana:
- Web UI for visualizing and searching
- Complex aggregations, graphs, charts
- Often used for Log analysis.
Diagram of ELK stack:
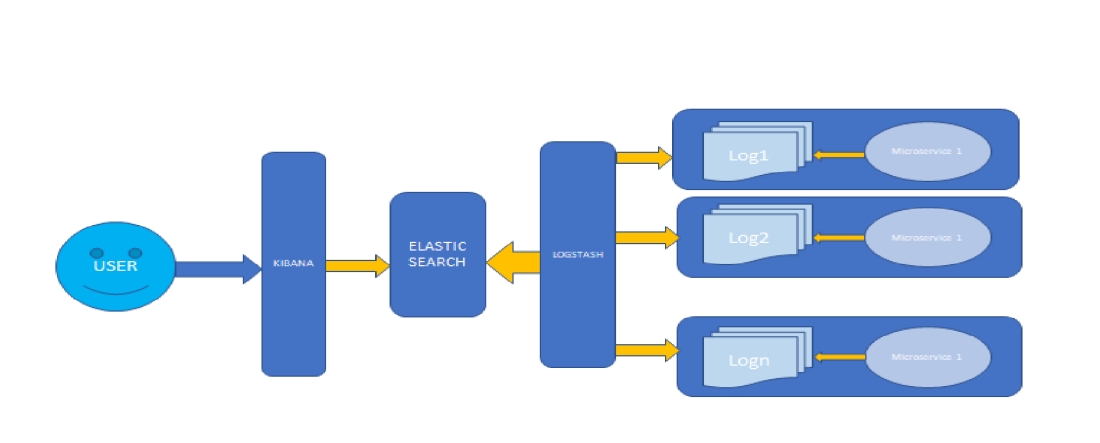
Flow of the above diagram:
Here User can view the logs from KIBANA which is the UI for ELK cluster.
Logstash will listen to the application logs and convert them to JSON format and send them to Elastic Search.
The microservices logs will be provided to the Logstash server.
How to configure ELK stack:
Elastic Search Configuration:
- Download Elastic Search from: here
- Run the elasticsearch.bat file in bin folder.
- Elastic Search will be up and running in port: http://localhost:9200
Kibana Configuration:
- Download kibana from: here
- Open config\kibana.yml file and set the elasticsearch.url over there
- Run bin\kibana.bat
- Kibana will be up and running in http://localhost:5601
Logstash Configuration:
- Download Logstash from: here
- Configure Logstash.cong file. The rules and guidelines for configuring the Logstash file is provided in the site. A simple configuration file looks like below:
input { stdin { input {
file {
path => “/var/log/messages”
type => “syslog”
}
file {
path => “/var/log/apache/access.log”
type => “apache”
}
} } }
output {
elasticsearch { hosts => [“localhost:9200”] }
stdout { codec => rubydebug }
}]
- Run Logstash using the below command:
bin/logstash -f logstash-simple.conf
Configure the Spring Boot Application:
- Inside the properties provide the below mentioned inputs (log file and application name):
logging.file=elk-example.log
spring.application.name = elk-example
Verify Microservices logs:
- Run the microservices application and log the application behavior using LOG4J.
- Now check the log file present in specific location (here: elk-example.log)
- The same log can be seen now in Kibana UI.
To be Continued…

Nice post
LikeLike